
Table of Contents
We’ve been listening to your feedback and have just released a UI refresh for manager dashboards and survey reports. This better reporting experience lets you filter survey reports by company, team, or individual, giving you the level of detail you need to take meaningful action!
New dashboard for managers
Now when you login to Insight, you’ll see a dashboard with four informational cards. The dashboard gives you an at-a-glance view of how your team is doing. It also shows you exactly where you need to spend your time and energy to support your employees.
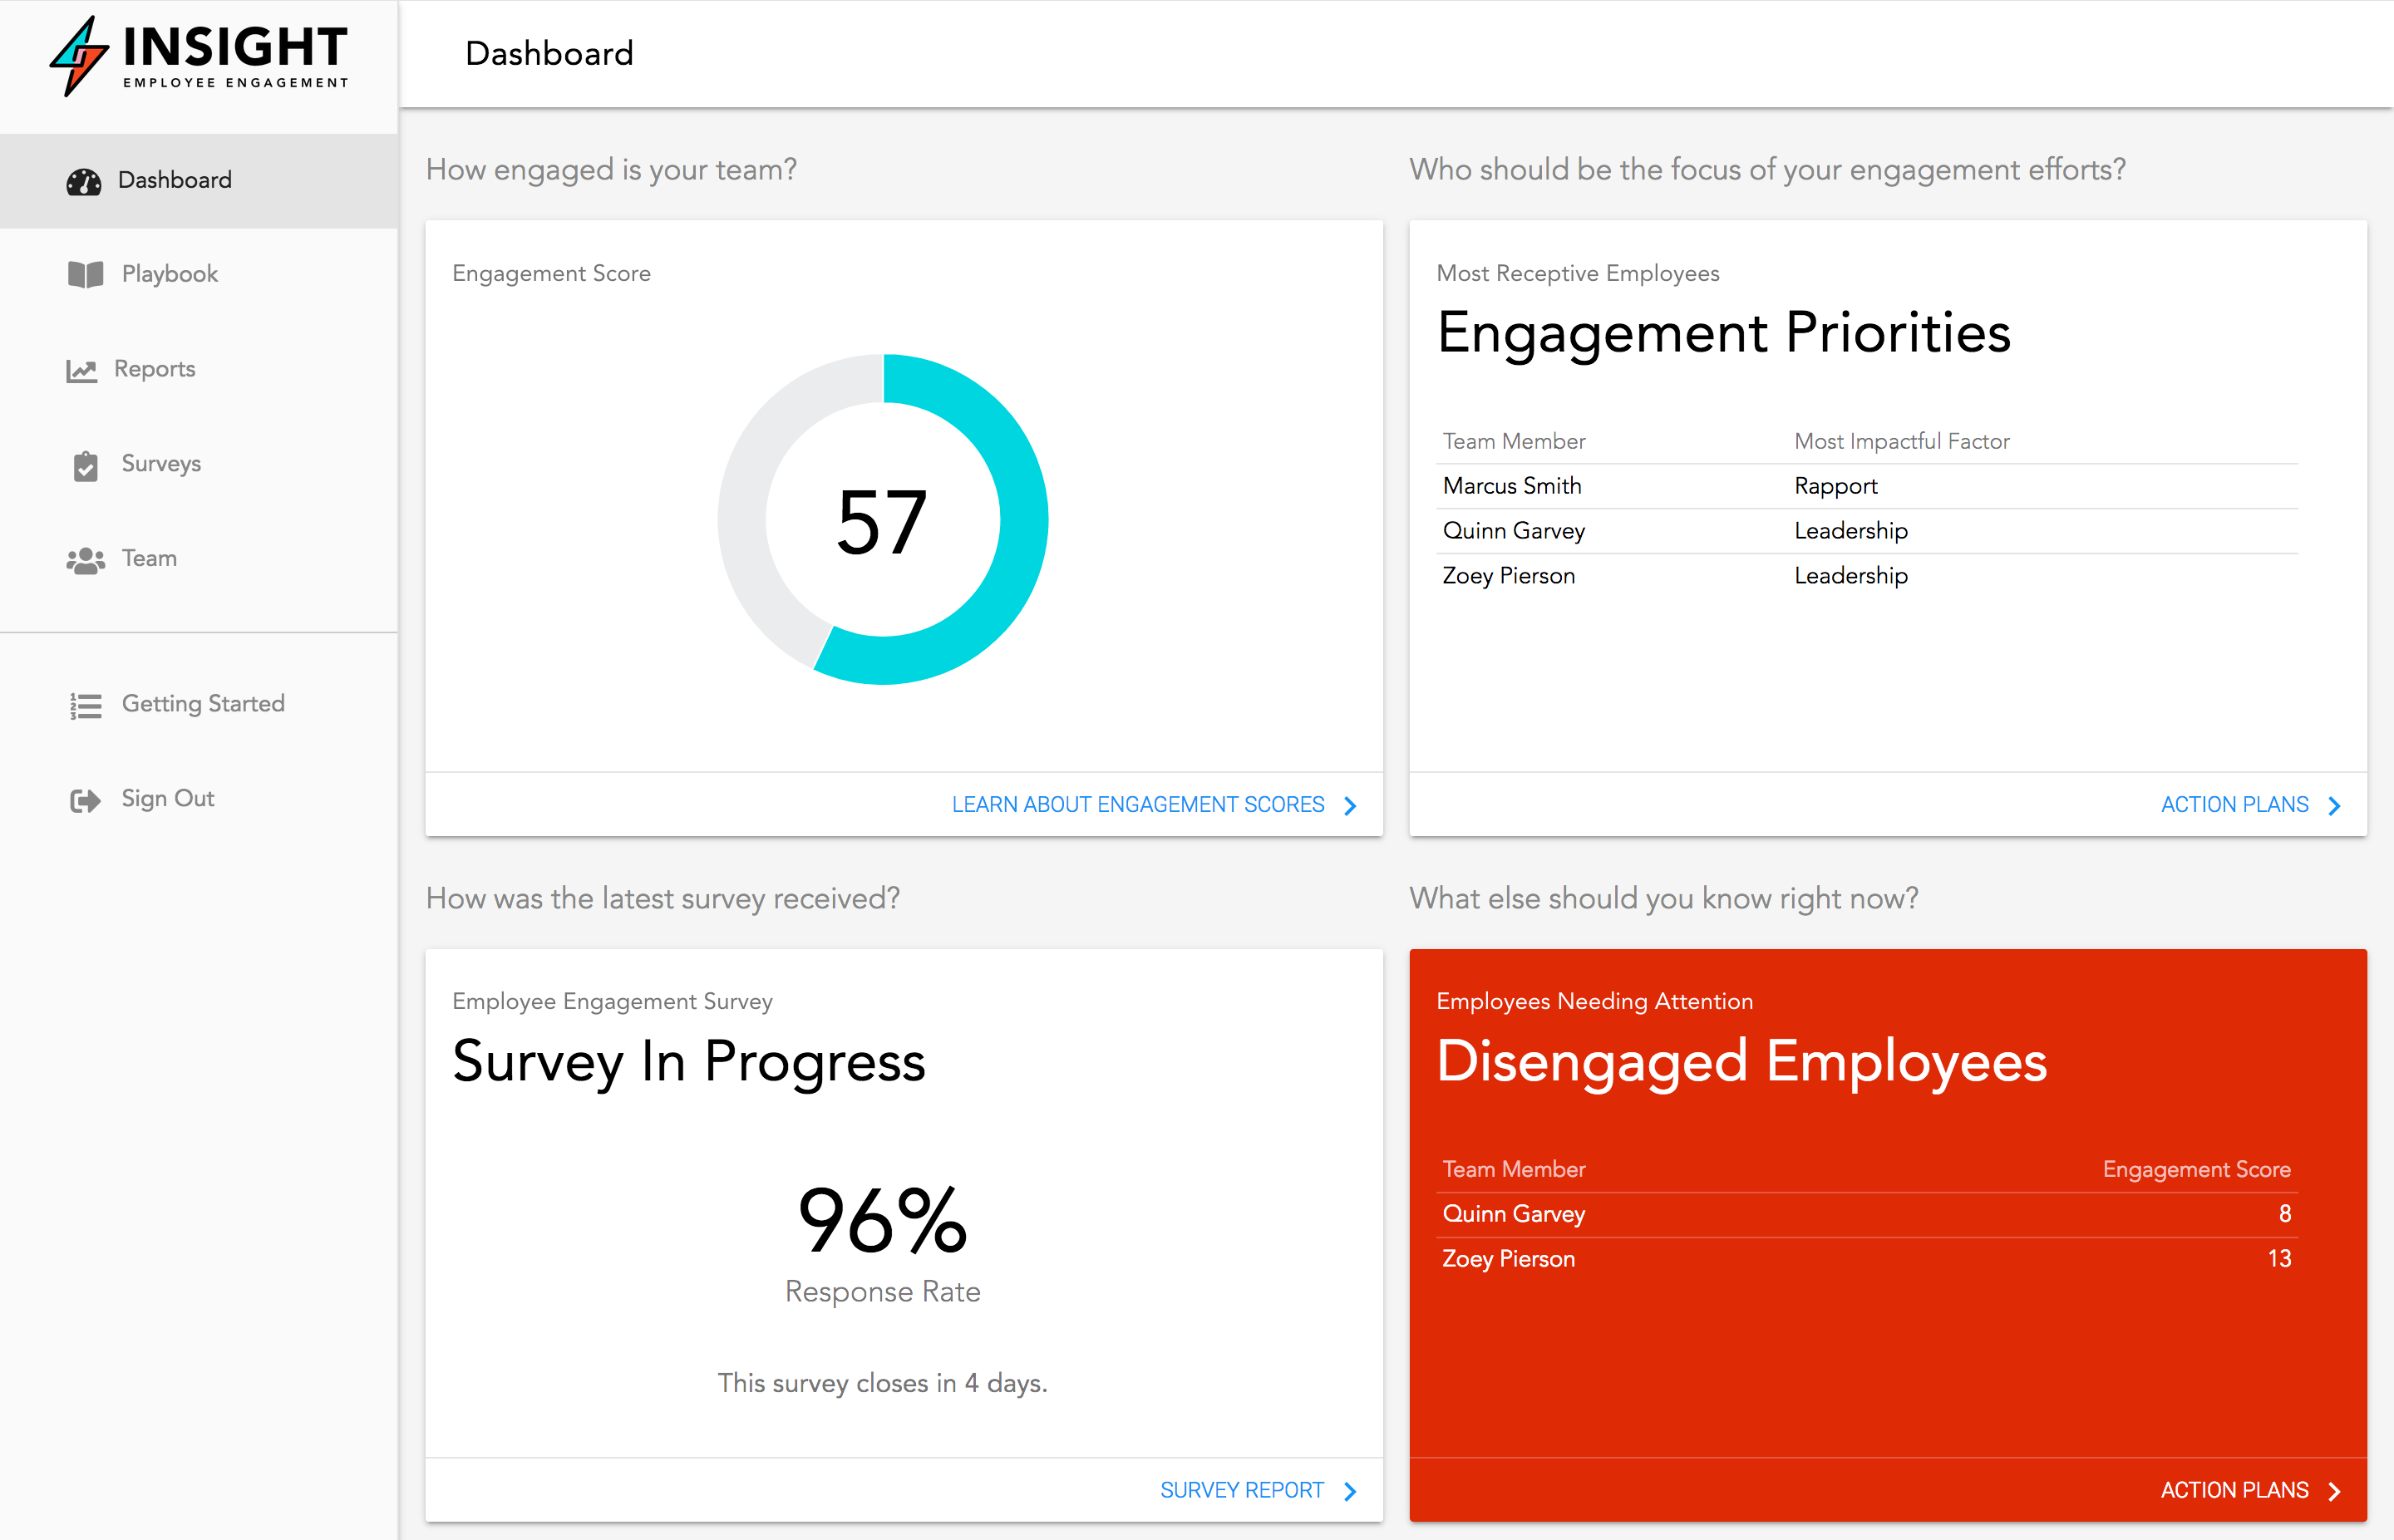 Insight Dashboard
Better reporting for survey results
Survey reports now focus on describing the state of employee engagement on your team. The top row of cards show you the current status of the survey, including your team’s overall engagement score and survey response rate.
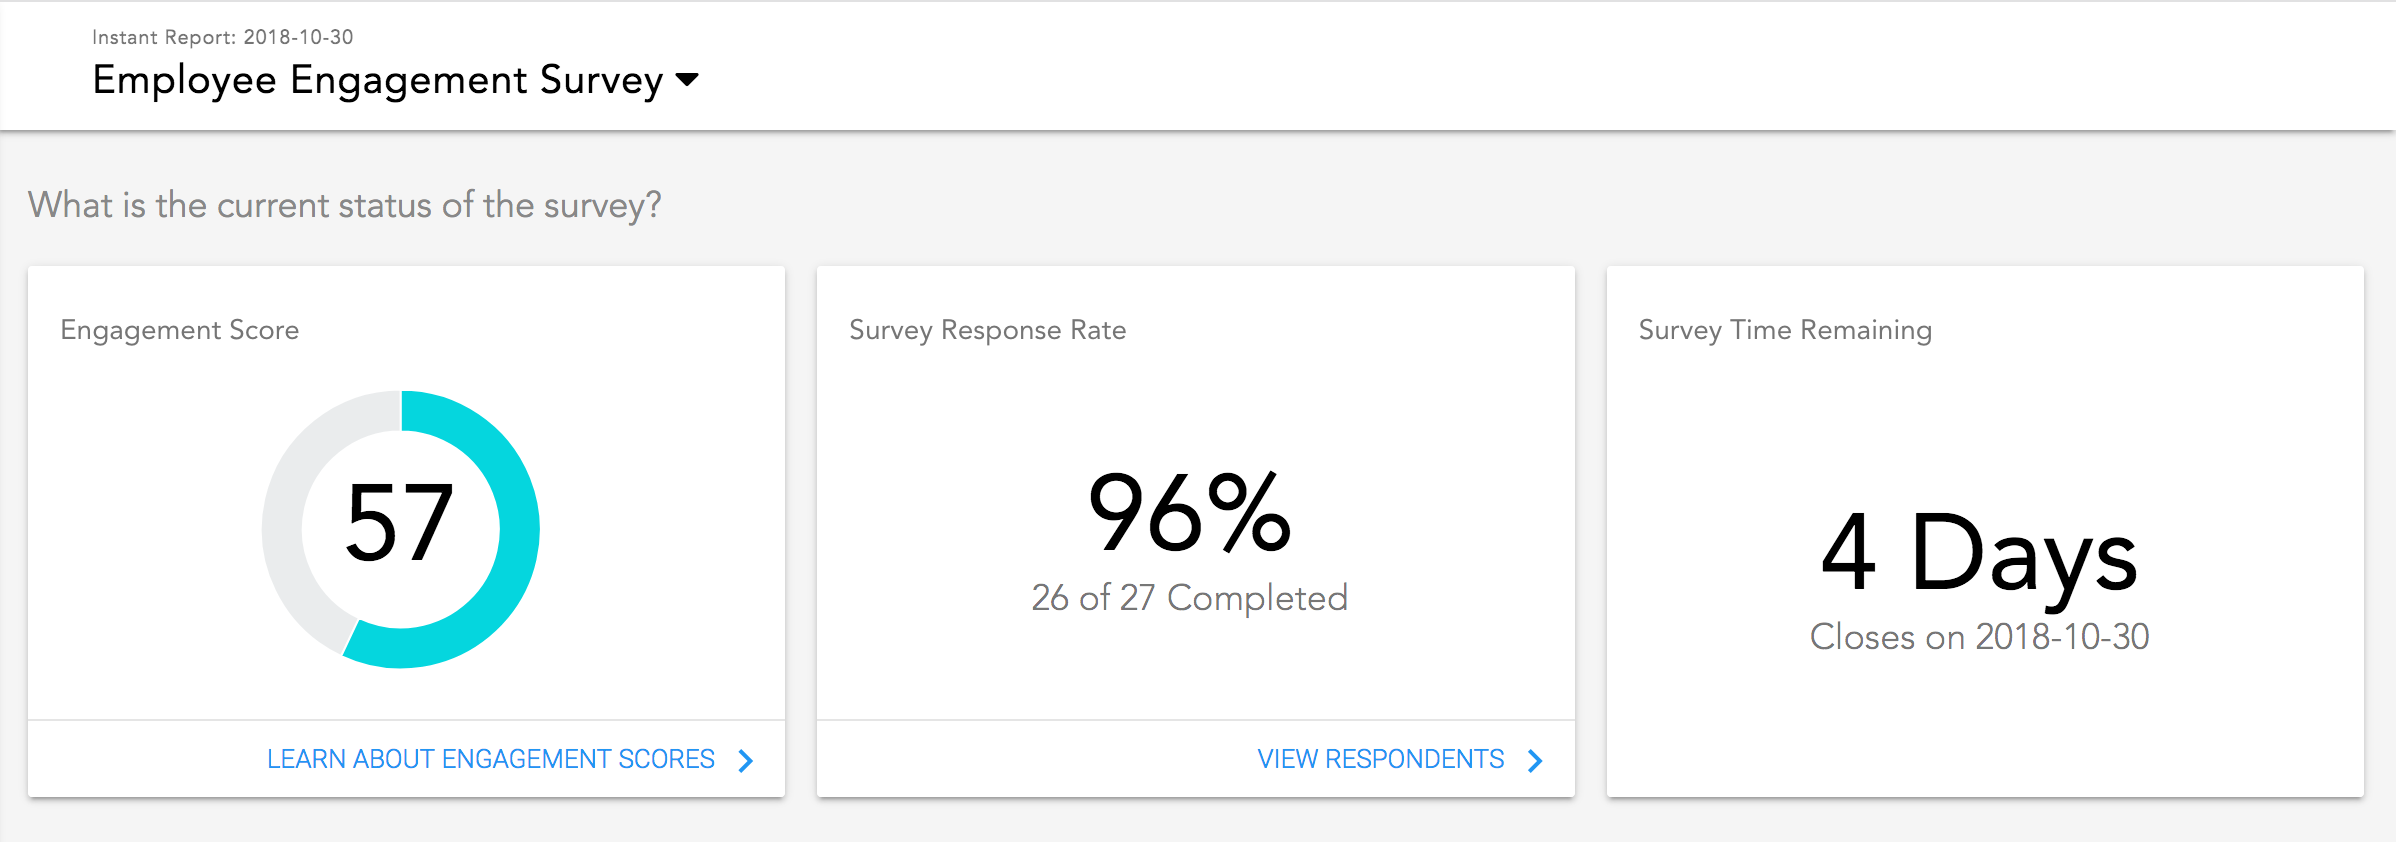 Insight instant report widgets
You can drill in to respondents to see who has or has not responded to the survey. Also, there are more informational links to help you better understand the science behind our surveys. Information on engagement score calculations, the reasoning behind the types of questions we ask, and details about our twelve engagement factors are all just one click away.
Team Engagement Heatmap
Just below the survey status cards, you will find a team engagement heatmap. This heatmap shows you how positively survey respondents favor each engagement factor. The heatmap breaks down scores by overall team, your direct reports’ teams, and your direct reports’ individual scores.
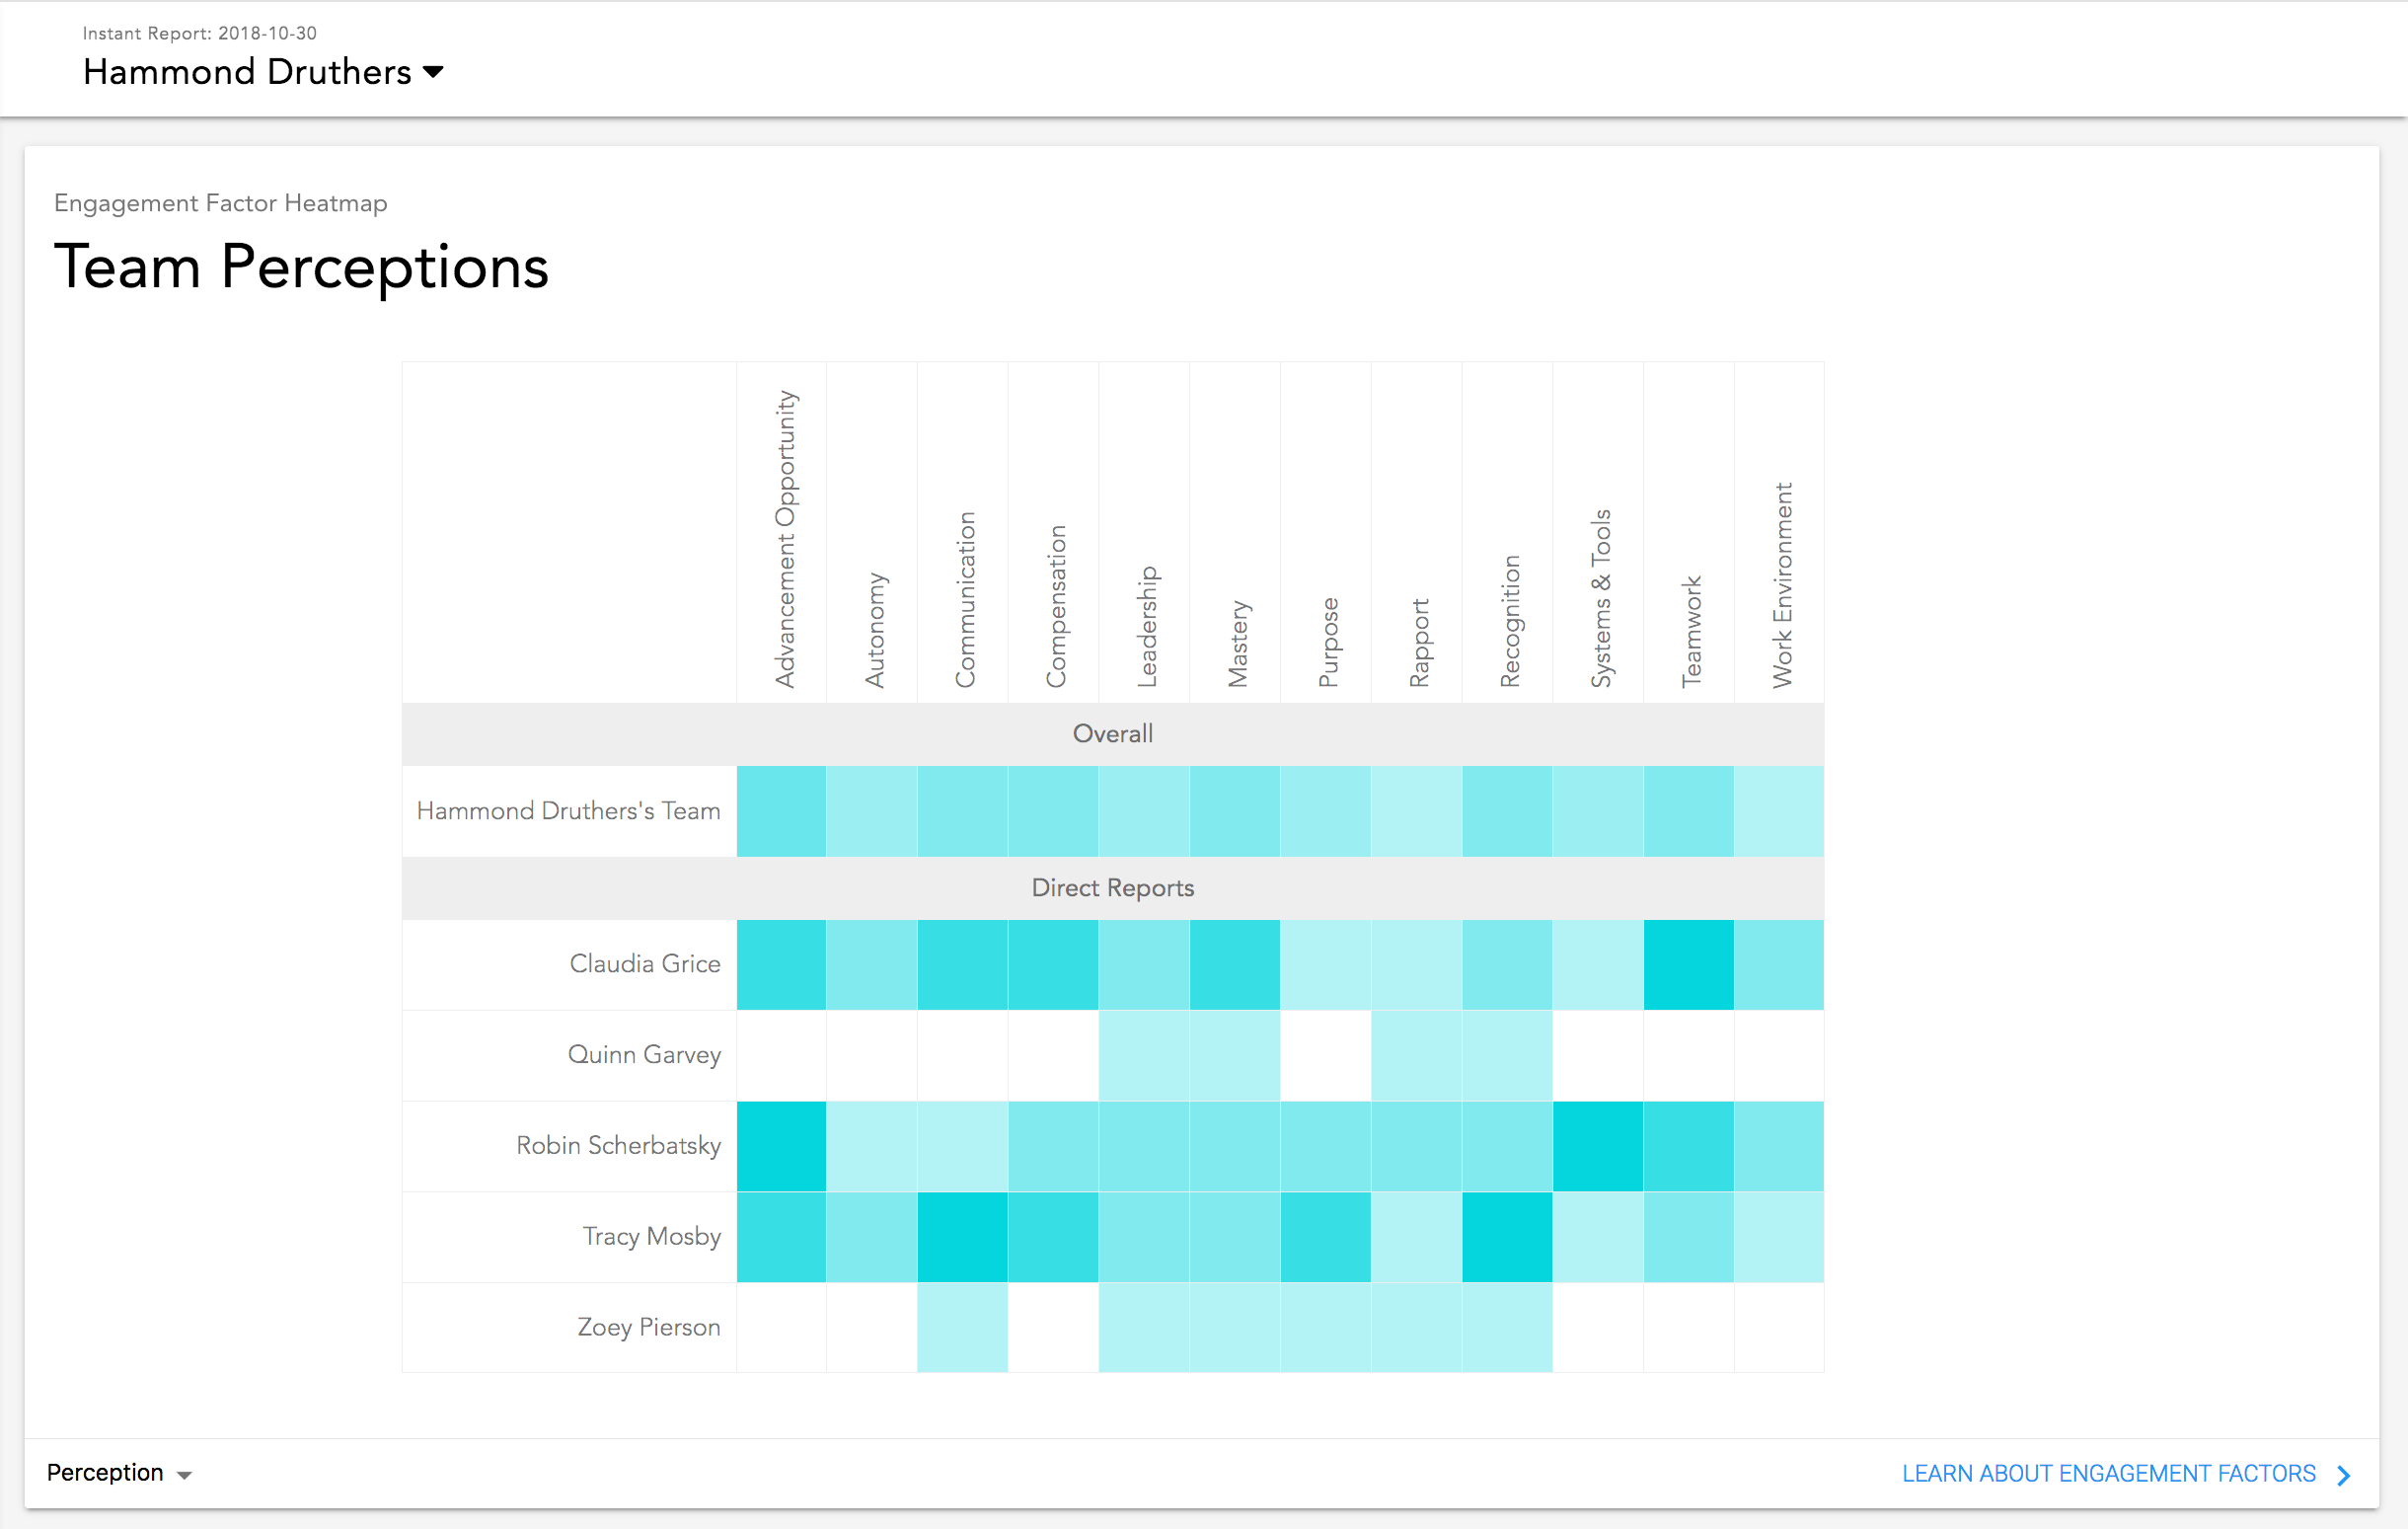 Team engagement heatmap
Employee Engagement Quadrant
The employee engagement quadrant (EEQ) is displayed just below the team engagement heatmap. The EEQ shows you how responsive each employee is to your engagement efforts. More information about the EEQ can be found in our article “What is the Employee Engagement Quadrant?”
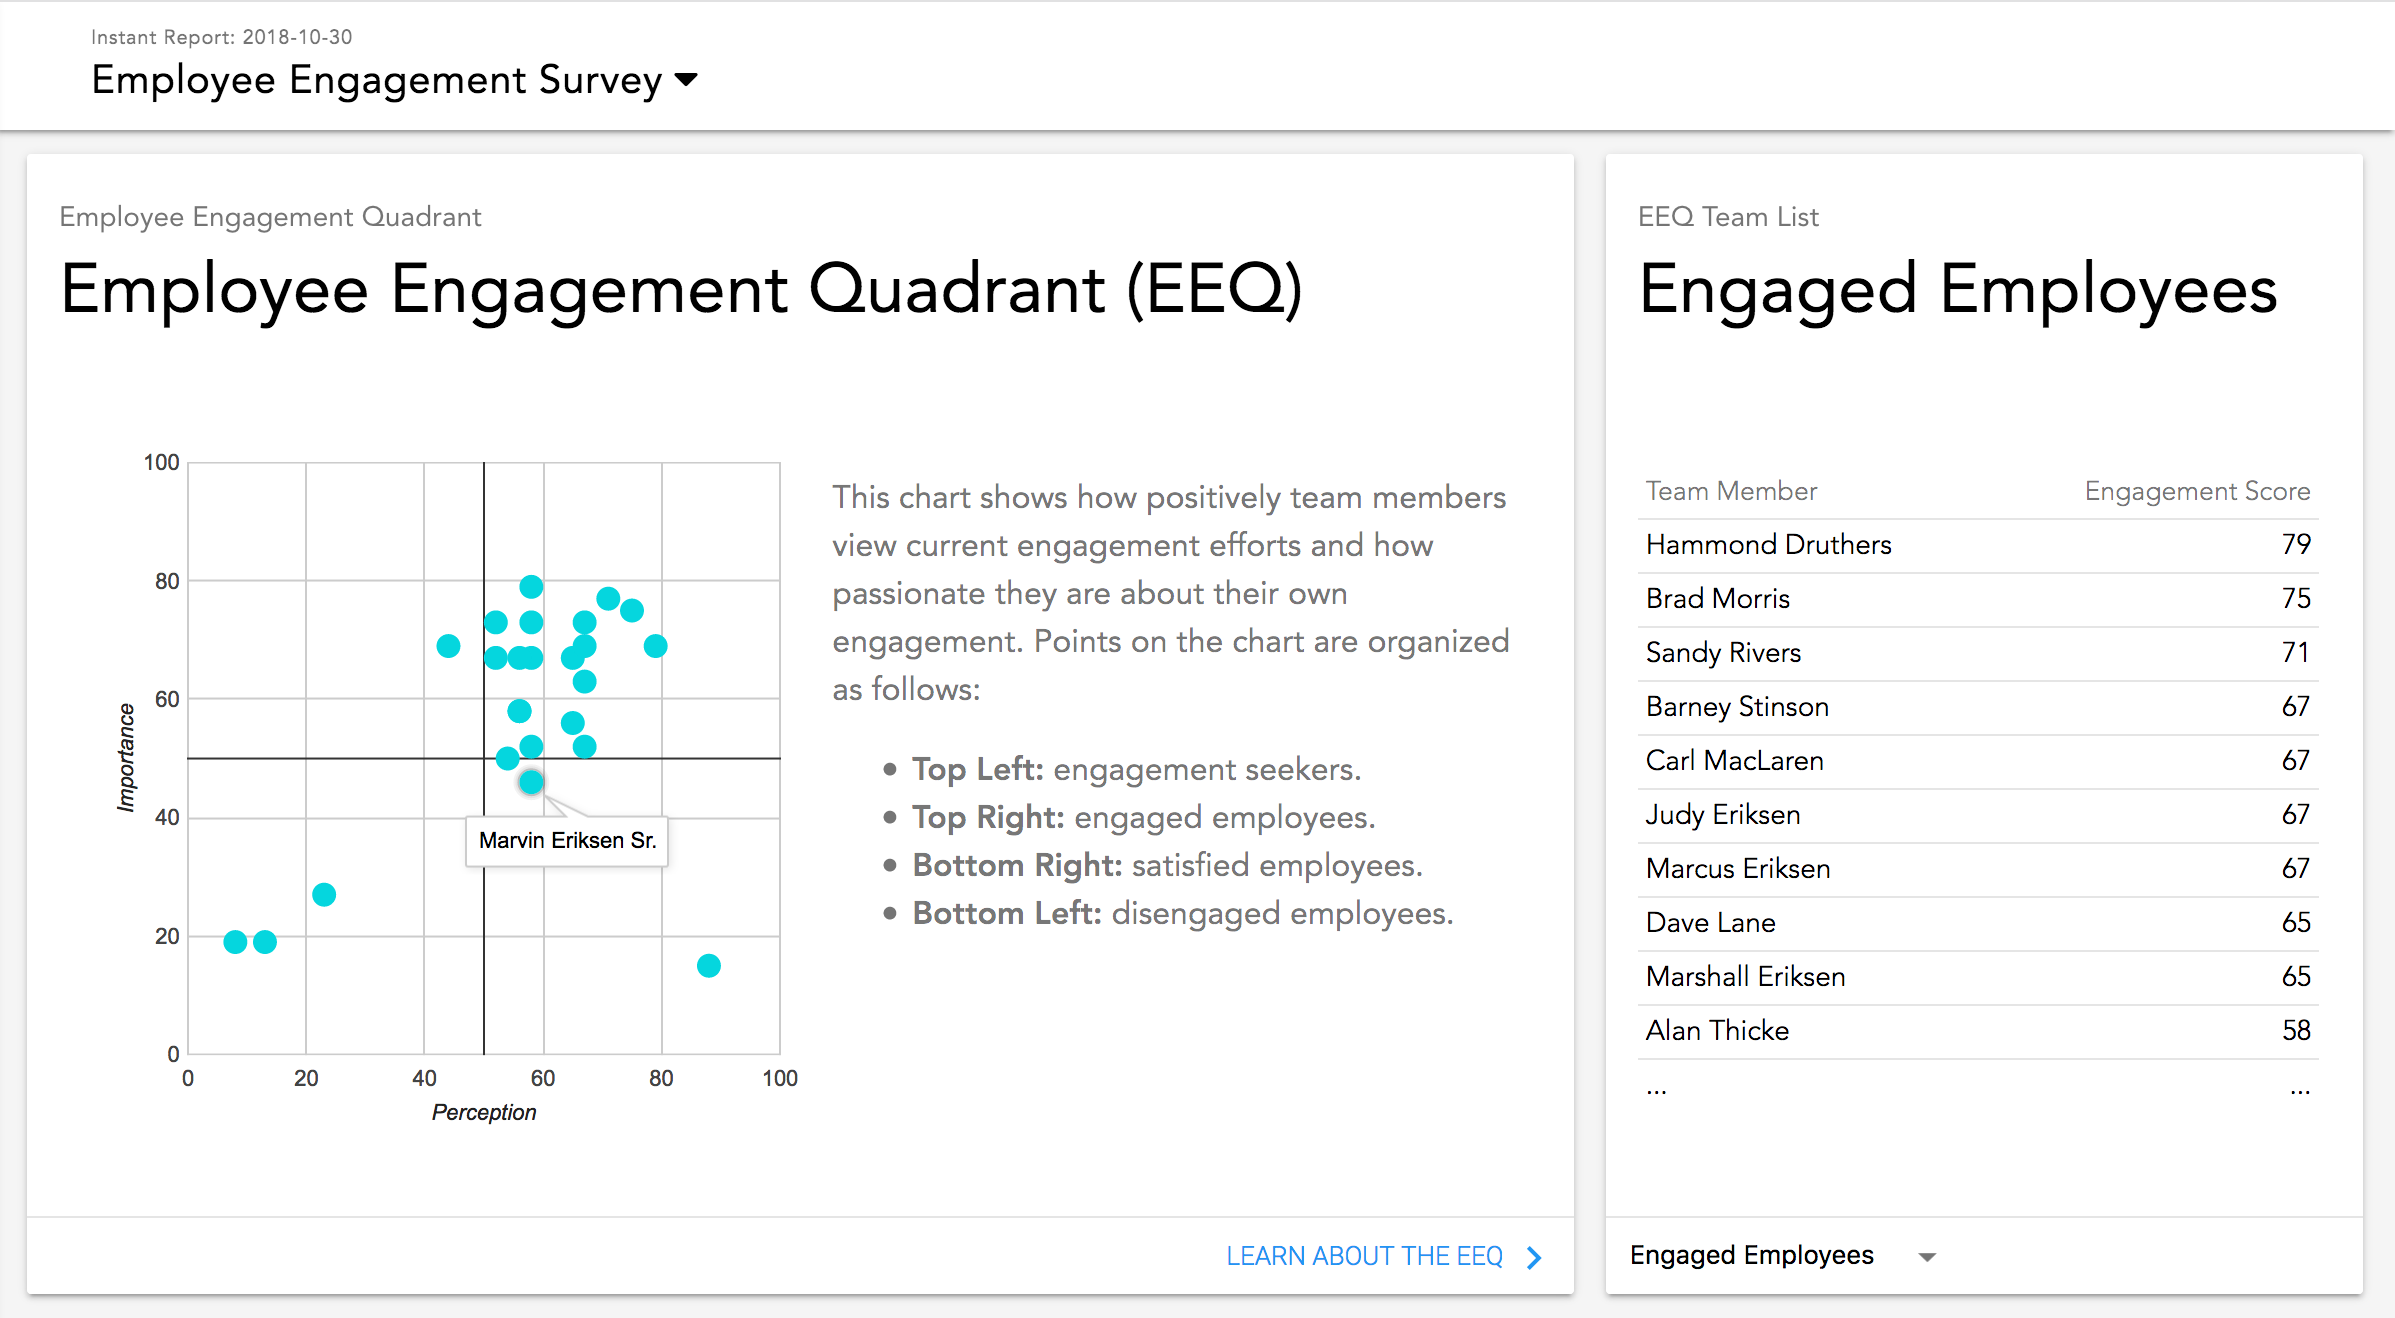 EEQ and Team List
Beside the EEQ, you’ll find a list of employees filtered by EEQ quadrant. This presents the same data as the EEQ, but in a format that may be easier to understand. However, the list lets you quickly scan for names and scores you’re most interested in, versus searching for the desired dot on the EEQ.
Survey Response Heatmap
Finally, this improved reporting presents a heatmap of responses to each employee engagement survey question. This heatmap shows you how many people gave a certain response to each question. At a glance, this better reporting view shows you how favorably people view different aspects of employee engagement.
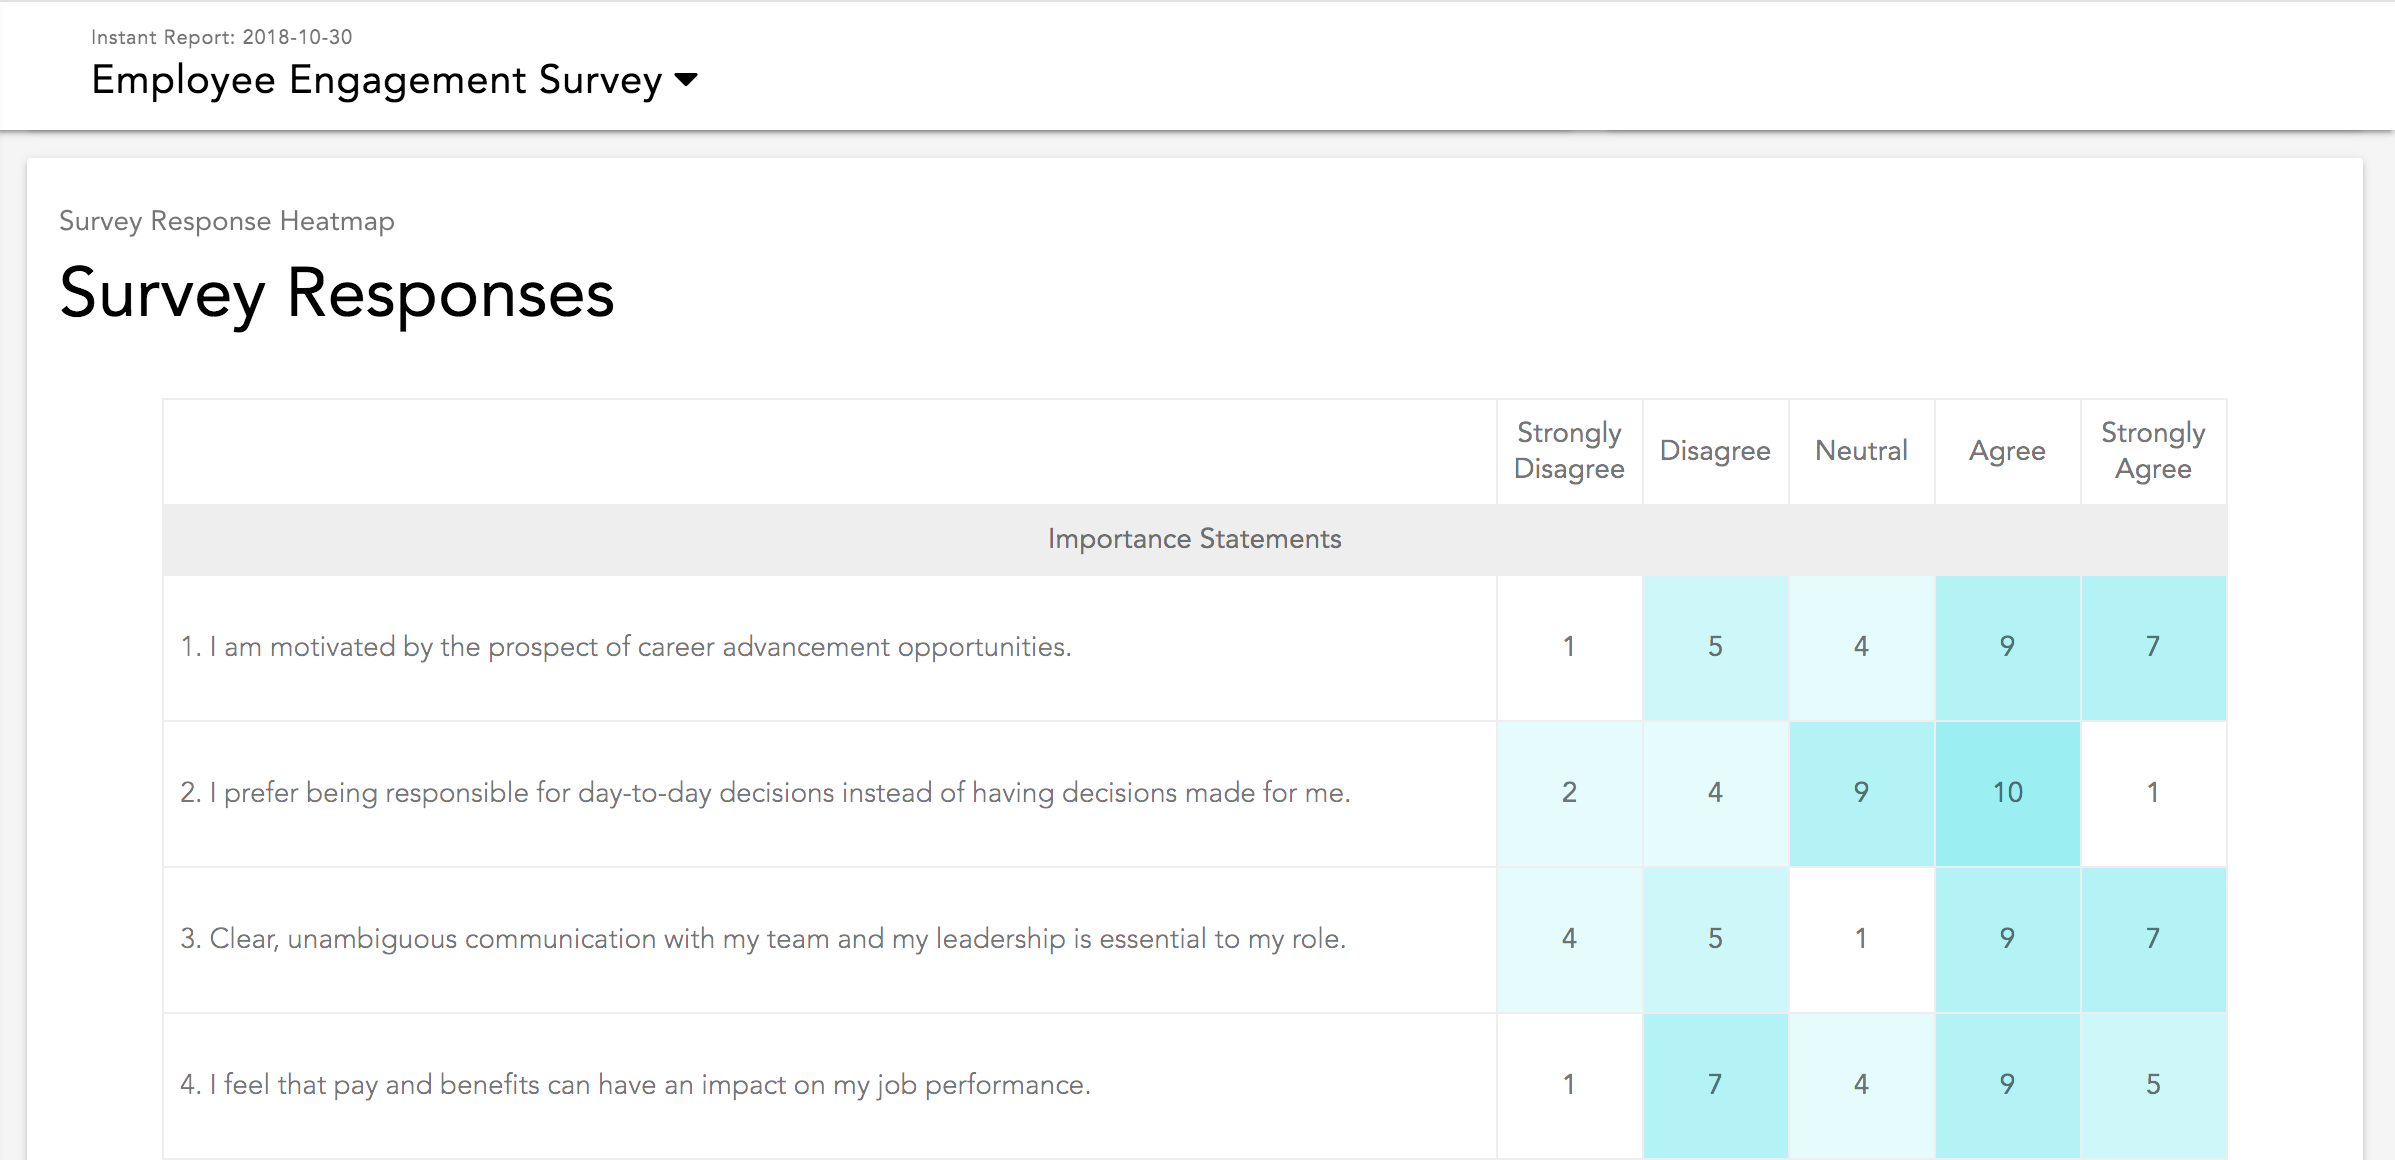 Survey response heatmap
Better reporting for historical trends
You will see trends across surveys on our new historical report screen. First you’ll see a timeline of your team’s engagement score. Also on this timeline is a dashed line representing the number of action plan items completed during each survey period. You should see corresponding improvements in your overall engagement score as you complete more actions with your team.
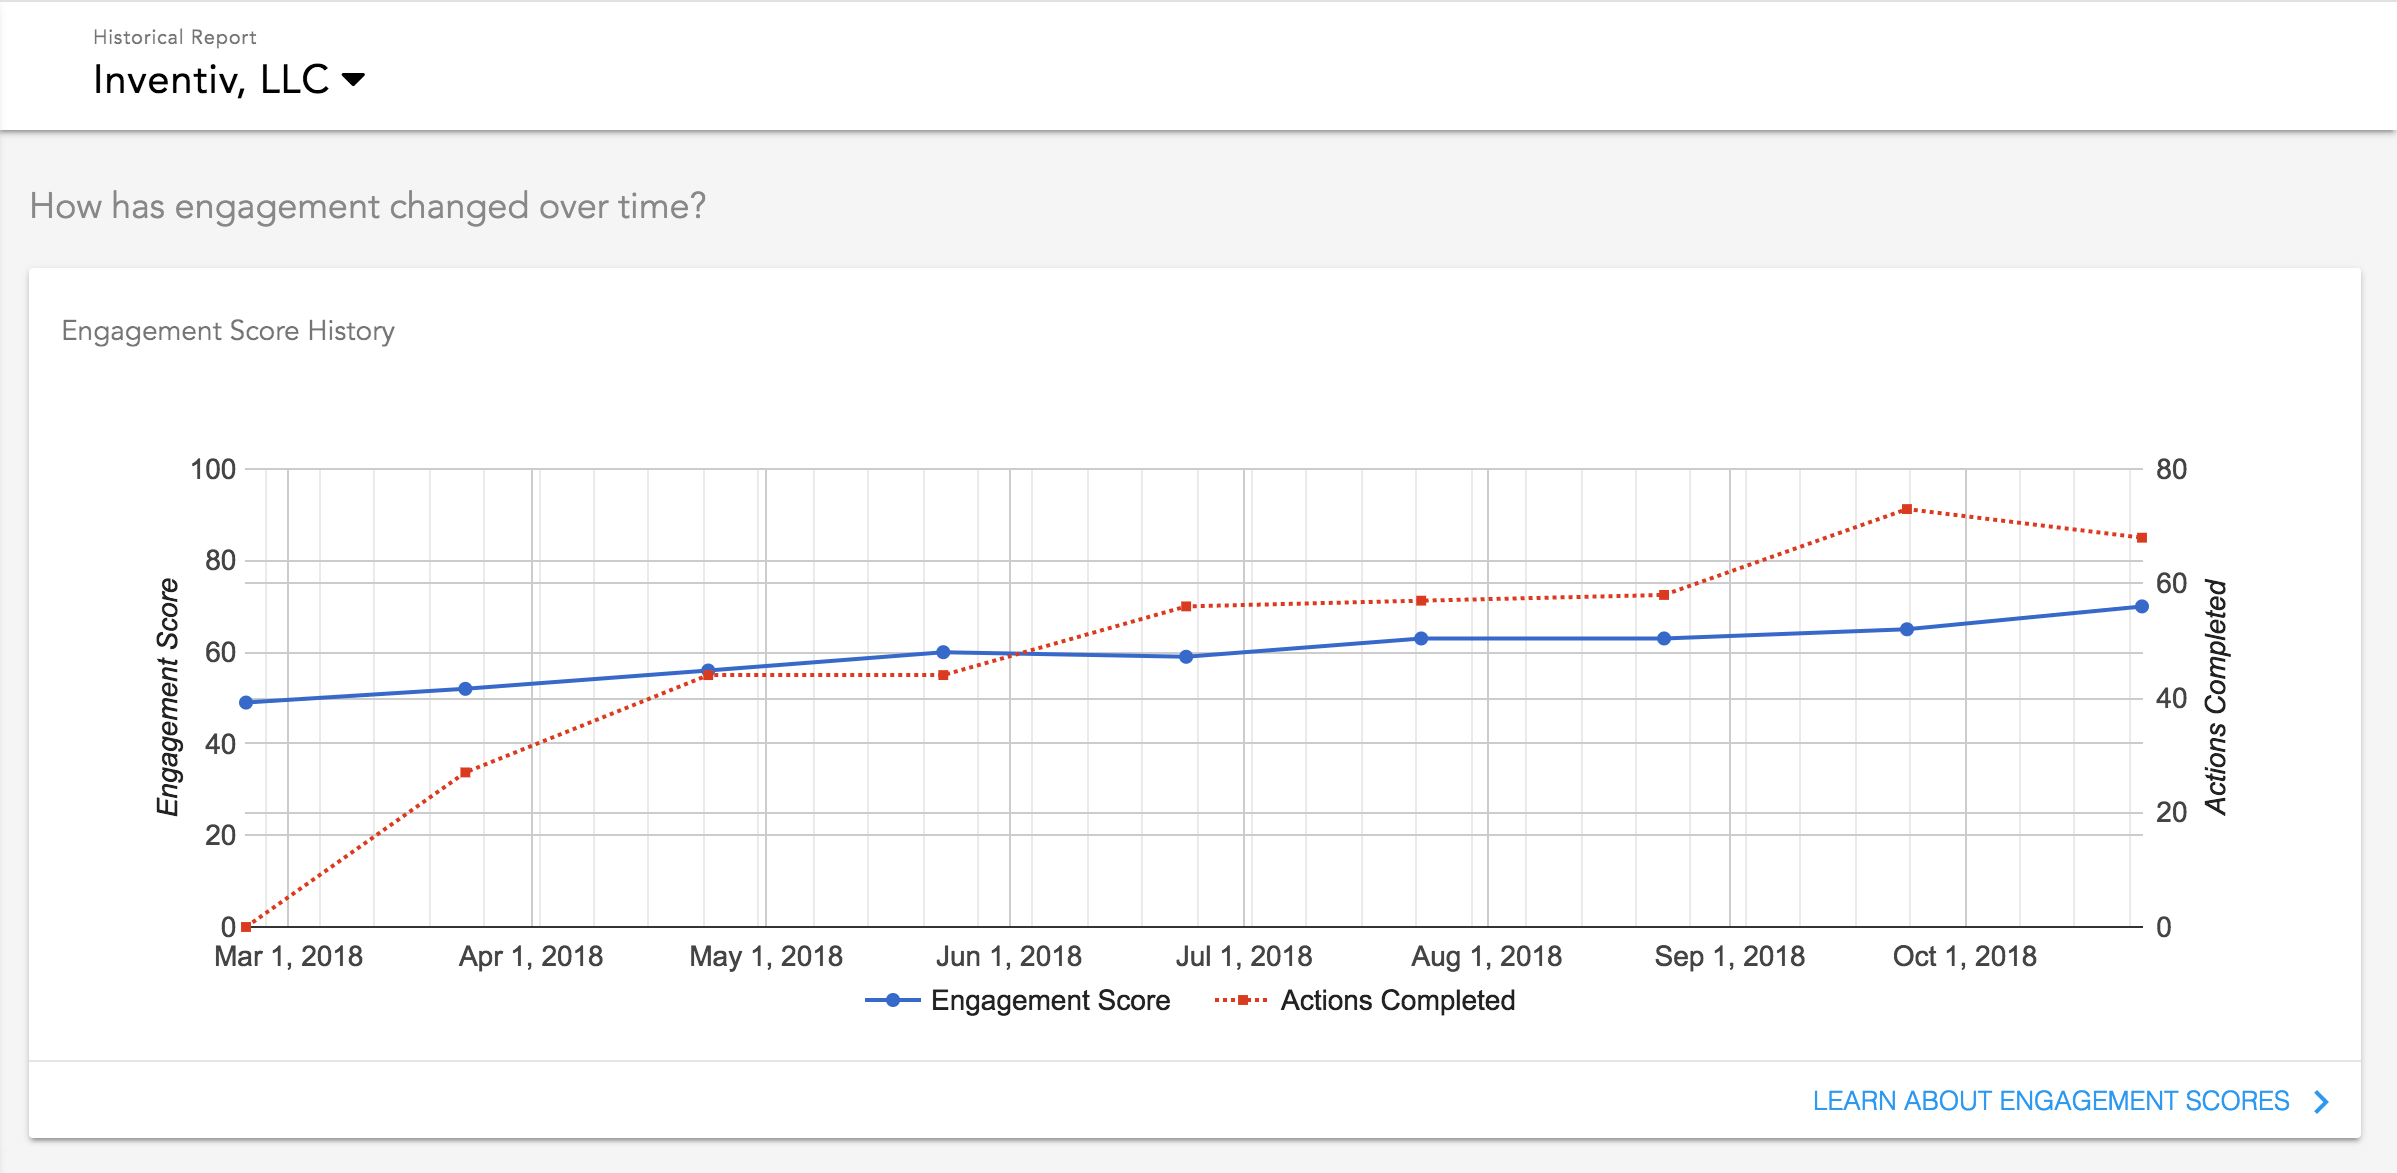 Engagement score timeline
Next is a timeline that illustrates engagement factor perceptions and importance. You can choose whichever engagement factors you’d like to see. Each engagement factor is represented by two lines. The solid line is the team’s perception of how the company demonstrates their support of the engagement factor. The dashed line represents importance, how much the team values the engagement factor.
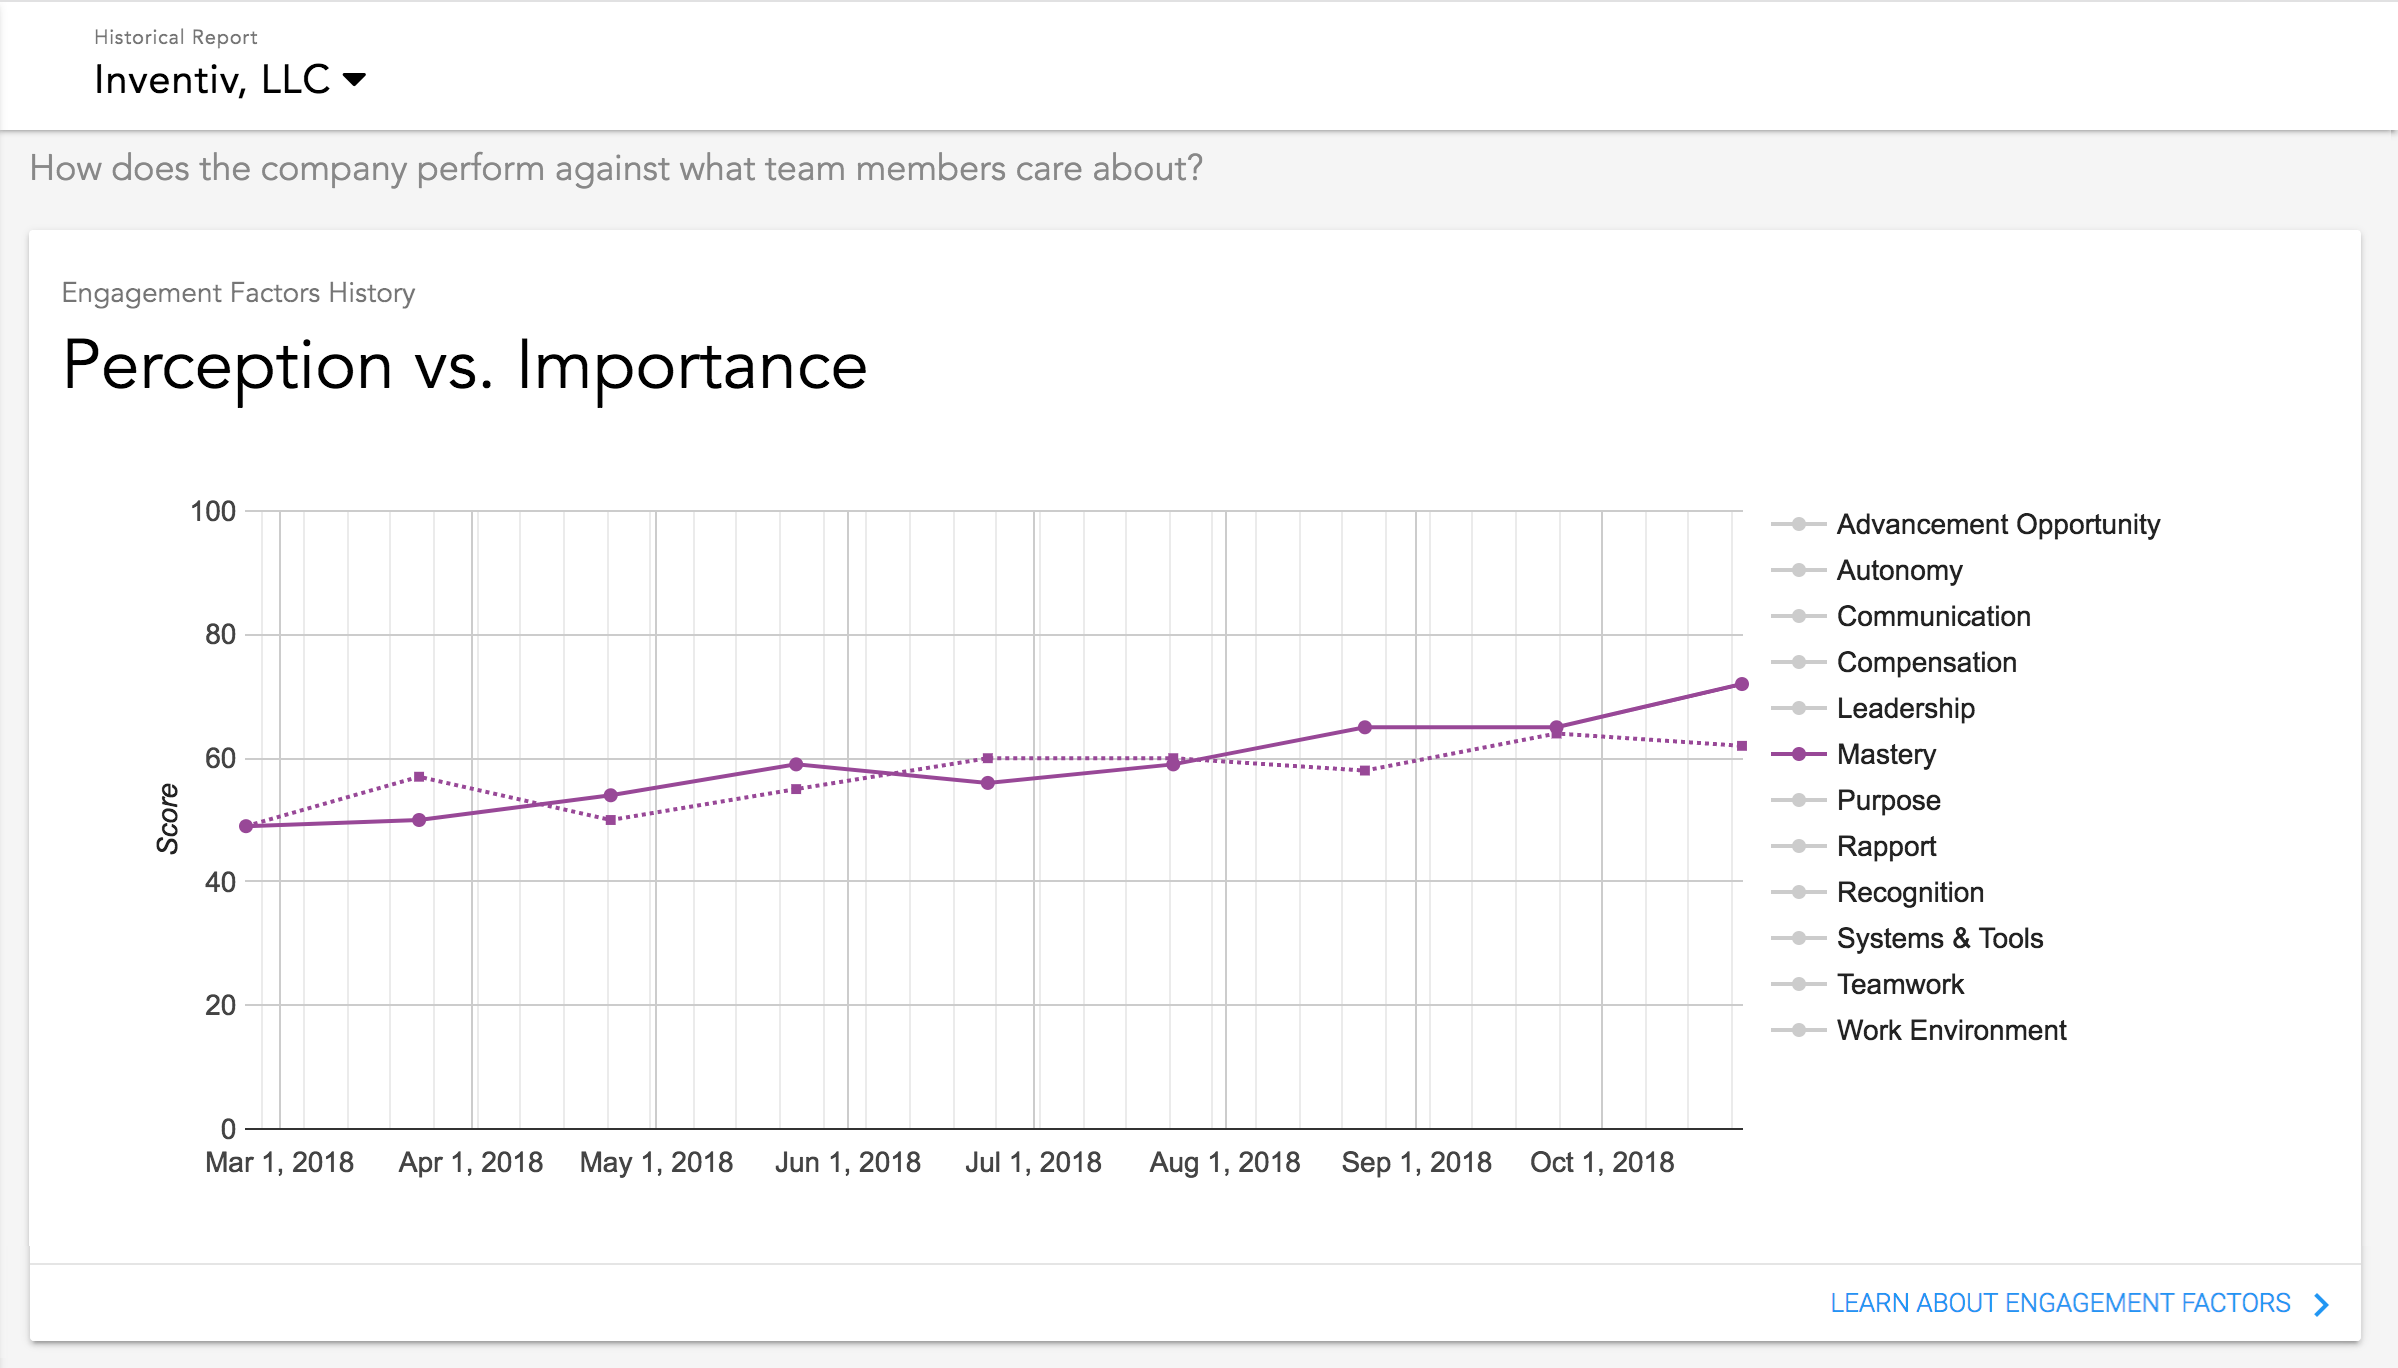 Employee engagement factors timeline
Filter your reports by survey, team, or employee
All of these new and improved reports include reporting filters so you can choose the level of detail you want to see. View a survey report for the entire company, or drill down to the section of your org chart you’d like to see. You can filter reports down all the way to the individual employee, so you can go as high or as deep as you need. Similarly, you can filter historical reports by company, team, or individual.
 Report picker
Mobile reporting for on-the-go leaders
Previously some of our reports were difficult to view on mobile devices. We took mobile and tablet users into consideration when improving reports, so now you can view any report on any modern computing device.
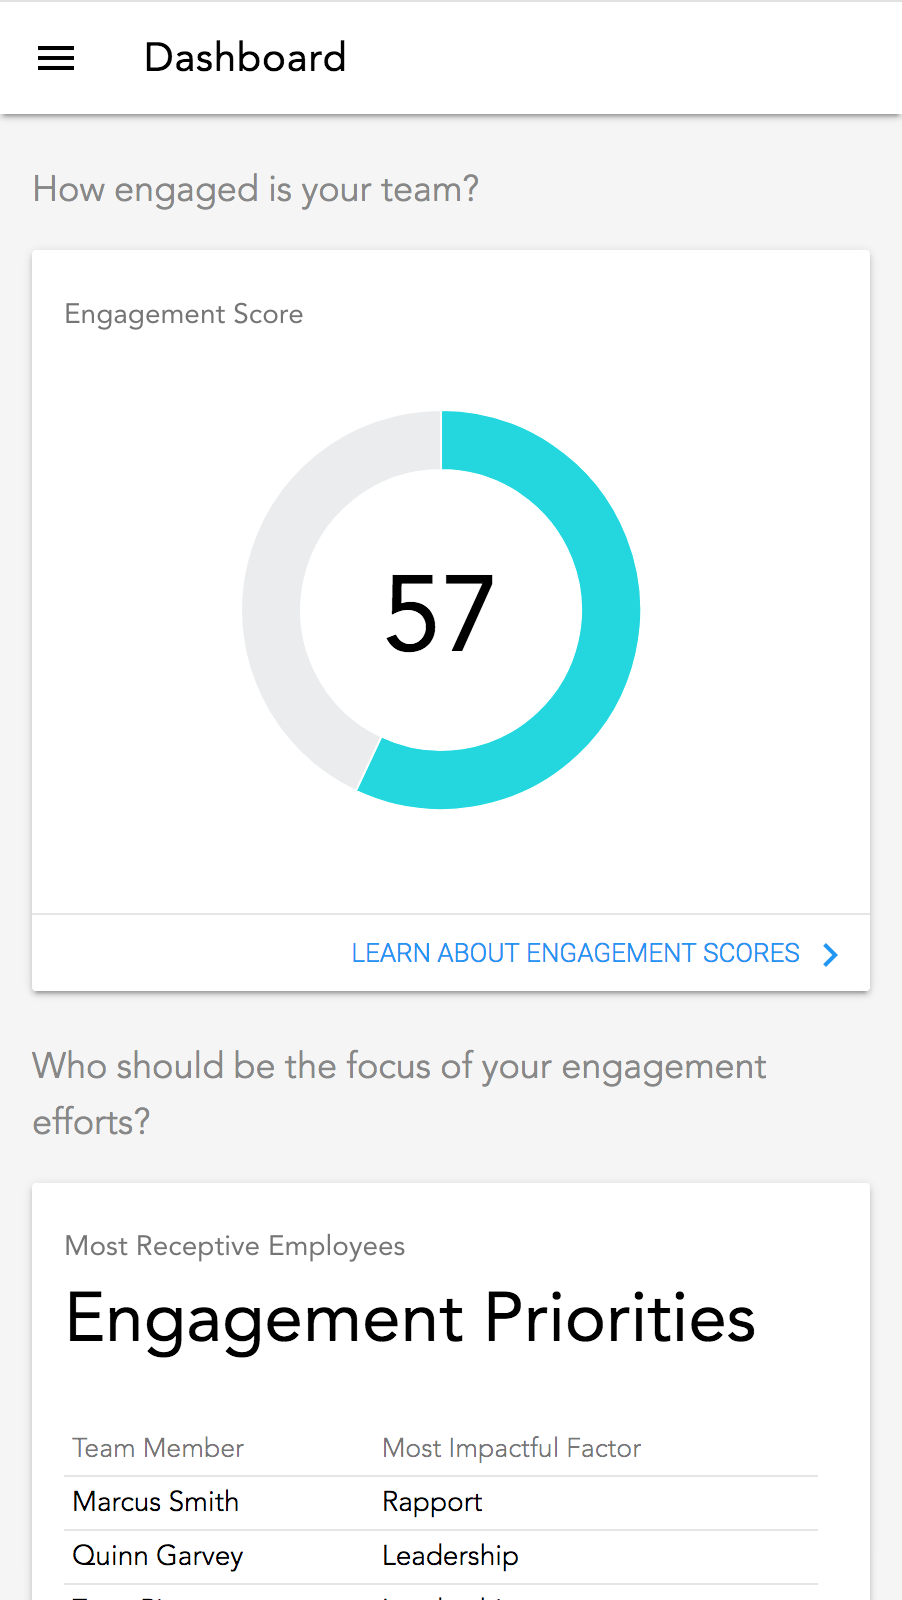 Mobile dashboard view
The best part is that there’s no app to install. Simply visit Insight in your preferred mobile web browser and you’ll have access to all of the same reporting improvements you see in the desktop experience.
 Mobile survey results view
Do you want to improve your leadership skills?
Create an account for Insight and you’ll have access to our entire leadership playbook. The playbook includes specific actions you can take with your employees to increase employee engagement. Review example conversation scripts, real-world ideas, and simple ways to get started. We also offer highly relevant employee engagement activities catered to each employee. Send an employee engagement survey with Insight and we’ll show you exactly how you can best support each team member based on what they care about most.
It’s free to get started, but the leadership guidance is invaluable. Give Insight a try.